Sokeri Get the extension

Two Chrome extensions · Manifest V3 · Chrome 116+

Your Libre or Dexcom readings, now in your browser toolbar.

Pick the edition that matches your sensor, sign in with the account you already use on your phone, and keep the current glucose value, trend arrow, last 24 hours of chart and threshold alerts one click away. Your data stays in this browser — nothing is sent to any server.

  • Real time. The latest reading from your sensor — LibreLinkUp graph or Dexcom Share, depending on the edition.
  • One-minute setup. Developer mode → load unpacked folder.
  • Privacy first. One network permission per edition (*.libreview.io or the Dexcom Share servers); no analytics, ads or third parties.

Two editions, one panel

Same toolbar badge, chart, alerts and settings — only the sign-in and the data source differ. Choose the edition that matches your sensor. You can install both side by side.

Sokeri for FreeStyle Libre

For Abbott FreeStyle Libre sensors (Libre 2 / 3).

  • Sign-in. LibreView email + password; two sessions are opened (portal + LibreLinkUp).
  • Real time. LibreLinkUp connection graph with five trend arrows; needs the one-time “follow yourself” setup.
  • Fallbacks. Your own graph → portal report → 14-day summary — whichever path works is shown.
  • Network. Only https://*.libreview.io/*.
Download Libre ZIP 1.1.0

Sokeri for Dexcom

For Dexcom G6 / G7 systems via Dexcom Share.

  • Sign-in. Dexcom email + password with an account region (US / outside US / Japan); no invitation or follower setup needed.
  • Real time. Up to 288 shared values over the last 24 hours (5-minute steps) with Dexcom trend arrows.
  • Sessions. Share sessions last about 24 hours; the extension asks you to sign in again afterwards.
  • Network. Only the three Dexcom Share hosts (share2, shareous1, share.dexcom.jp).
Download Dexcom ZIP 1.1.0
Edition comparison at a glance
TopicLibre editionDexcom edition
SensorsFreeStyle Libre 2 / 3Dexcom G6 / G7
Sign-inLibreView email + passwordDexcom email + password + region
Regions / serversAutomatic redirect (api*.libreview.io)US / outside US / Japan (share2, shareous1, share.dexcom.jp)
Real-time pathLibreLinkUp graph (follow-yourself setup)Share values, up to 288 / 24 h
FallbacksOwn graph → portal report → 14-day summarySign in again (sessions last ~24 h)
Multi-personFollowed-person selectorMultiple Dexcom accounts with switcher
Shared panelBadge, chart (3/6/12/24 h + 7 d) with prediction line, TIR / GMI / %CV, snoozable + repeatable alerts, night escalation, signal-loss watch, reports (TIR bar, pattern heatmap, PDF, clinic mode), events, CSV, themes

Both editions are unofficial community builds. Sokeri is not affiliated with Abbott, FreeStyle Libre, LibreView or Dexcom; brand names are shown only to mark compatibility.

The whole extension, right here

The preview below shows the extension's real screens — switch between the three views and explore the chart and settings. The values are sample data; both editions share this panel, only the sign-in screen differs.

libreview.com — toolbar extension
  1. Live value and status

    The value, its unit and the status label are written together: “In range”, “High” or “Low”. Colour alone is never the only signal; the status is always stated in text too.

  2. Trend arrow and age

    Five arrow directions — steady, rising, falling, rising fast and falling fast — shown together with how many minutes ago the reading arrived.

  3. Chart and target band

    3, 6, 12 or 24 hour series; the 70–180 mg/dL target band is drawn as a shaded strip. The series grows as data arrives and anything older than 15 days is dropped.

  4. Six statistics, plus the delta

    Time in range (TIR), average, lowest, highest, below-range and above-range shares, calculated for the selected time span — and the delta next to the trend arrow, the change since the first reading in the range (as in “142 +5”).

A day in thirty seconds

A simulated day, one hour per second — the readings are made up. Watch the value, the trend arrow and the delta follow the playhead while the chart draws itself, with the day's lowest and highest points marked.

— mg/dL → +0 00:00

Simulated data for illustration — not measurements. Dots mark the lowest and highest reading of the visible part of the day.

What it does, and how

Both editions do four things: they show the reading, turn it into a chart, alert you when a threshold is crossed and convert units the way you prefer.

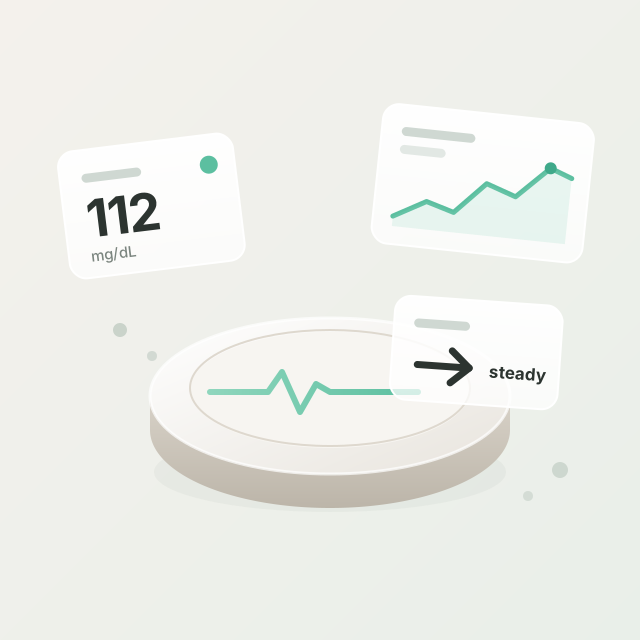
A sensor disc and three floating glass cards carrying an abstract line chart — illustrative image

A live reading in the toolbar

The extension icon's badge carries the latest value. The badge colour follows the thresholds you choose: dark green in range, amber when high, coral when low. If the value is older than 30 minutes the badge turns grey and shows … — so you never mistake a stale number for a current one.

Hover the badge and the tooltip shows the time of the last reading and any error text. One click opens the panel, another click opens the full chart.

Alerts when a threshold is crossed

When your low or high threshold is crossed a desktop notification appears; optionally a two or three tone sound plays with it. The notification carries Snooze 15 min / 1 h buttons, and a Repeat setting decides how often the alert re-fires while you stay out of range (once, or every 5–30 minutes). At night a low always escalates to every 5 minutes with a louder sound.

A separate signal-loss watch warns when no new reading arrives for 20 minutes — a dead sensor or a phone that stopped uploading never goes unnoticed. The predicted-low alert draws its dashed projection right on the chart.

The Test notification button in settings fires a real notification and sound. Thresholds are stored in mg/dL and converted to whichever unit you display.

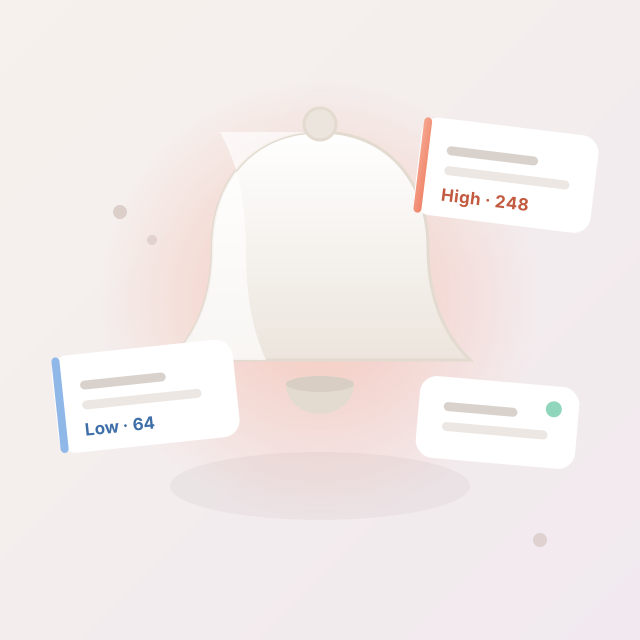
A floating ceramic bell with soft alert cards around it — illustrative image

Reading and chart

  • Live value + trend arrow. From the LibreLinkUp connection graph; five arrow directions, with the age of the reading.
  • 3 / 6 / 12 / 24 hour chart. Shaded target band, axis labels and a readout line.
  • TIR, average, lowest, highest. For the selected range; the stored series covers up to 15 days.
  • Snooze, repeat, signal-loss. Snooze any alert from the notification itself, choose the repeat interval, and get warned when readings stop arriving.
  • Reports view. 7-day time-in-range bar, weekly daily-pattern heatmap, CSV export, a one-page PDF report for doctor visits and a full-tab clinic mode — all generated locally, nothing uploaded.
  • Two data sources, same panel. The Libre edition tries connection graph → your own graph → portal report → 14-day summary; the Dexcom edition reads up to 288 shared values. Whichever path works is shown.

Alerts and settings

  • High / low threshold alerts. Desktop notification with snooze buttons, optional sound, configurable repeat, night escalation for lows, signal-loss watch.
  • mg/dL ↔ mmol/L. One button converts the whole screen instantly; thresholds are entered in your unit too.
  • 1 / 2 / 5 minute refresh. The timer is set with chrome.alarms; no tab has to stay open.
  • Session memory. When off, the session is cleared as soon as the browser closes; when on, it lives only in local storage.
  • Predicted crossing + dashed chart line. When the trend points at a threshold inside 15/30 minutes you get a warning and see the projection drawn ahead on the chart.

How the data arrives

Each refresh tries its edition's paths in order and the first successful one provides the data. The order matters: anything real time is tried before anything less real time.

Libre edition

  1. 1

    LibreLinkUp connection graph

    GET /llu/connections followed by the …/graph endpoints. This is the real-time path: the latest reading that went from sensor to phone to LibreLinkUp, plus roughly 14 hours of series.

  2. 2

    Your own reading's graph

    Without a connection, …/connections/{yourId}/graph is tried. If you follow yourself in LibreLinkUp this path is open directly — a one-time setup for real-time data.

  3. 3

    LibreView portal report

    /reportSettings → /reports → wait for the report channel to become ready → download the report HTML and parse the window.report object. This path returns the readings your phone has uploaded to LibreView, so it can be slightly delayed.

  4. 4

    14-day summary

    /glucoseHistory?numPeriods=5&period=14 returns a summary only: average, lowest, highest. If no path works the extension still shows this and writes what failed, and why, into the “No data?” list.

Dexcom edition

  1. 1

    Authenticate the account

    POST …/General/AuthenticatePublisherAccount with your Dexcom email, password and region turns the credentials into an account id. The region matters: the US, outside-US and Japan accounts live on different servers.

  2. 2

    Open a Share session

    POST …/General/LoginPublisherAccountById turns the account id into a session id. Share sessions last about 24 hours; when one expires the extension asks you to sign in again.

  3. 3

    Read the latest shared values

    POST …/Publisher/ReadPublisherLatestGlucoseValues with minutes: 1440, maxCount: 288 returns up to 24 hours of readings in 5-minute steps. The newest value is the live reading; its Trend field (DoubleUp … Flat … DoubleDown) becomes the trend arrow.

Two sessions, one account (Libre)

Signing in opens two sessions with your email and password: the LibreView portal session (history and report flow) and the LibreLinkUp session (real-time readings). Both are the same Abbott account; if even one succeeds you are signed in.

No tab has to stay open

Refresh is scheduled with chrome.alarms. Even when the service worker sleeps in between, the timer is recreated and the countdown does not reset. Every refresh updates the badge and checks the thresholds.

Region and headers (Libre)

Regional redirection (api.libreview.io → api-eu.libreview.io and so on) is followed automatically. LibreLinkUp endpoints receive the product, version and Account-Id headers; portal endpoints reject those headers, so they are not sent there.

One session, three servers (Dexcom)

The Dexcom edition keeps a single Share session per sign-in. Use the region your account was registered with — US (share2.dexcom.com), outside US (shareous1.dexcom.com) or Japan (share.dexcom.jp); the wrong region simply rejects the password.

Install in three steps

Both extensions are developer packages, not store listings, so you install them through Chrome's “load unpacked” route. It takes about a minute per edition.

  1. 1

    Download and unzip

    The buttons above download sokeri-chrome-extension.zip (Libre) and sokeri-dexcom-extension.zip (Dexcom). Unzip the one you need somewhere permanent on your computer — the extension keeps working as long as you do not delete the folder.

  2. 2

    Turn on developer mode

    Type chrome://extensions into the address bar and press Enter. Turn on the Developer mode toggle in the top right.

  3. 3

    Load the package

    Click Load unpacked and select the folder you unzipped. The icon appears in the toolbar; click it and sign in with your LibreView or Dexcom account, depending on the edition.

    When an update arrives: replace the folder's files and press Reload on the chrome://extensions page.

Questions and troubleshooting

The most common situations and how to solve them.

Why do I need to follow myself to get real-time data?

The LibreLinkUp API only provides real-time data to accounts with a follower relationship. To see your own readings you need to follow yourself: install the LibreLinkUp app on your phone, invite your own email address with Add participant, then accept the invitation in the LibreLink app. This is a one-time setup. If you skip it the extension falls back to the portal report path; that works too but can be delayed.

Sign-in says “failed” / a robot check appears

First, leave Region on “Automatic”. If a captcha or two-factor prompt appears, sign in once at libreview.com in the browser, complete that step, then try the extension again. Double check the email and password.

Dexcom sign-in says the password is wrong, but it is not

That almost always means the account region is wrong: US, outside-US and Japan accounts live on different servers and each server rejects the others' passwords. Switch the region on the sign-in screen (Finland and the rest of Europe use “Outside US”) and try again. Also confirm you are using your Dexcom account — the same one as the Dexcom app on your phone — not a Clarity or clinic login.

Dexcom shows no data / asks me to sign in every day

Two separate things. No data: open the Dexcom app on your phone and make sure it is signed in with the same account, has an internet connection and an active sensor — the extension can only show what your phone uploaded. Daily sign-in: Dexcom Share sessions last about 24 hours by design, so the extension asks you to sign in again the next day. Your thresholds and settings are kept.

Do I need a follower invitation for the Dexcom edition?

No. The Dexcom edition reads your own account's shared values directly, so there is no “follow yourself” step. That step exists only in the Libre edition, where the LibreLinkUp API requires a follower relationship for real-time data.

Can I snooze an alert? How often do alerts repeat?

Yes. Every threshold and prediction notification has Snooze 15 min and Snooze 1 h buttons — the alert stays silent until the snooze ends. The Repeat setting in the extension decides how often an alert re-fires while you stay out of range: once per episode, or every 5, 10, 15 or 30 minutes. At night a low always repeats every 5 minutes with a louder sound, regardless of the setting.

What is the signal-loss alert?

When no new reading arrives for 20 minutes the extension warns you — a dead sensor, an empty phone battery or a phone that stopped uploading all look the same: silence. The banner in the panel turns into a “check the sensor and the phone app” note, and a notification is sent (at most once an hour). Turn it off with the Signal loss checkbox in settings if you only wear the sensor at certain times.

What are the Reports view, the PDF and clinic mode?

The Reports button in the panel opens a second view: a 7-day time-in-range bar (below / in / above), a weekly daily-pattern heatmap that shows at which hours you usually run low or high, the CSV export, a one-page PDF report for doctor visits and a full-tab clinic mode with a big value and a 24-hour chart for night-time monitoring. Everything is generated locally in your browser — nothing is uploaded anywhere.

Can the Dexcom edition follow more than one person?

Yes — it keeps every Dexcom account you sign in with and an Account selector in settings switches between them (a parent can follow two children, for example). Each account's readings are stored separately on the device. Use the Add button next to the selector to sign in another account; signing out clears all of them.

I get a “no connection found” error

That means the real-time path is closed: follow the “follow yourself” steps above and press Refresh in the extension. If the steps are complete and data still does not arrive, open the “No data?” list to see what each path reported; you can share it as it is.

The value never updates or looks stale

The badge turns grey and shows … for values older than 30 minutes — that is a deliberate warning. Set the refresh interval to 1 minute and press Refresh. If it still does not update, hover the badge: the tooltip shows the time of the last reading and the error text.

Where does my data go? What do the permissions mean?

There are four permissions and one network scope: storage (settings and the latest value are kept in this browser), alarms (the refresh timer), notifications (threshold alerts), offscreen (an audio context for the alert sound) and https://*.libreview.io/* (Abbott's servers). No request is made outside that scope and no external code is loaded.

Is this a medical device?

No. Neither extension is a medical device, neither is intended for diagnosis or treatment, and neither is affiliated with Abbott or Dexcom. They are convenience displays for adults (18+). You use them entirely at your own responsibility; always confirm critical decisions with your sensor's own screen or your readings.

Do you use cookies or tracking?

No. This site sets no cookies, runs no analytics and has no accounts — see the Privacy section. The extensions likewise contain no analytics or advertising code; your readings never leave your browser except to your CGM provider's own servers.

Changelog

What changed, newest first. Full history in the repo.

1.1.0 — current

Predicted alerts with a dashed chart projection, signal-loss watch, snooze buttons, configurable repeat, night escalation, reports view (TIR bar, pattern heatmap, PDF, clinic mode), Dexcom multi-account, Finnish UI, onboarding tour and CSV import.

1.0.0

First release: badge value, trend arrow, charts, TIR / GMI / %CV stats, threshold alerts with night thresholds, events, CSV export and themes.

Privacy, cookies and compliance

Short version: this site collects nothing, and the extensions keep everything in your browser. The details below exist so the project meets the transparency rules that apply in the EU/EEA (GDPR, ePrivacy), the UK, the US and comparable regimes.

No cookies, no tracking

This site sets no cookies (no consent banner is needed because there is nothing to consent to), runs no analytics, loads no external code and has no accounts or contact forms. Server logs, if any are kept by the host, are outside this project's control — the pages themselves collect nothing.

What the extensions store

Readings, events, settings and the sign-in session live only in your browser's extension storage. Credentials go directly to your CGM provider (LibreView or Dexcom Share) and nowhere else. There is no cloud copy, no backup and no account — so there is nothing to breach, sell or subpoena.

Your rights and erasure

Because there is no account, access and erasure are instant and local: open the extension settings and use Delete all local data, or remove the extension — everything goes with it. Uninstalling the app and clearing the browser removes all copies.

Medical status

The extensions are general-wellness displays, not medical devices under the EU Medical Device Regulation or the US FDA framework: not for diagnosis, treatment or dosing decisions, for adults (18+) only. Trend prediction is experimental and labelled as such in the app.

Children and sensitive data

Glucose data is health data. Do not install the extensions on a child's device or enter anyone else's readings without their consent. Parents monitoring a child remain responsible for that child's care and for complying with local parental-consent rules.

Contact and trademarks

Sokeri is a community project with no legal entity behind it. For privacy questions, trademark concerns or takedown requests, use the contact address shown on the channel where you downloaded it. Third-party names (Abbott, FreeStyle Libre, LibreView, Dexcom) belong to their owners and appear only to mark compatibility.

Takes a minute, then lives in the corner of your tab.

Download a ZIP, turn on developer mode, pick the folder. From the moment you sign in, the latest reading is on your toolbar's badge.

Open source (MIT) — fork it on GitHub, adapt it to your needs and send improvements back.